Survey
The survey is the screen where you measure the points: the map with the project's points and your own position, a column of commands on the right and, at the bottom, the sheet with the Measure button. From the Home: Survey (a project must be open).
If the screen is short (for example split with another app) and the commands do not all fit in height, the column stays a single one and scrolls with your finger downwards, always showing whole icons.
While the survey is open the phone screen does not turn off by itself, as long as Screen always on in survey is on in the Settings (the default).
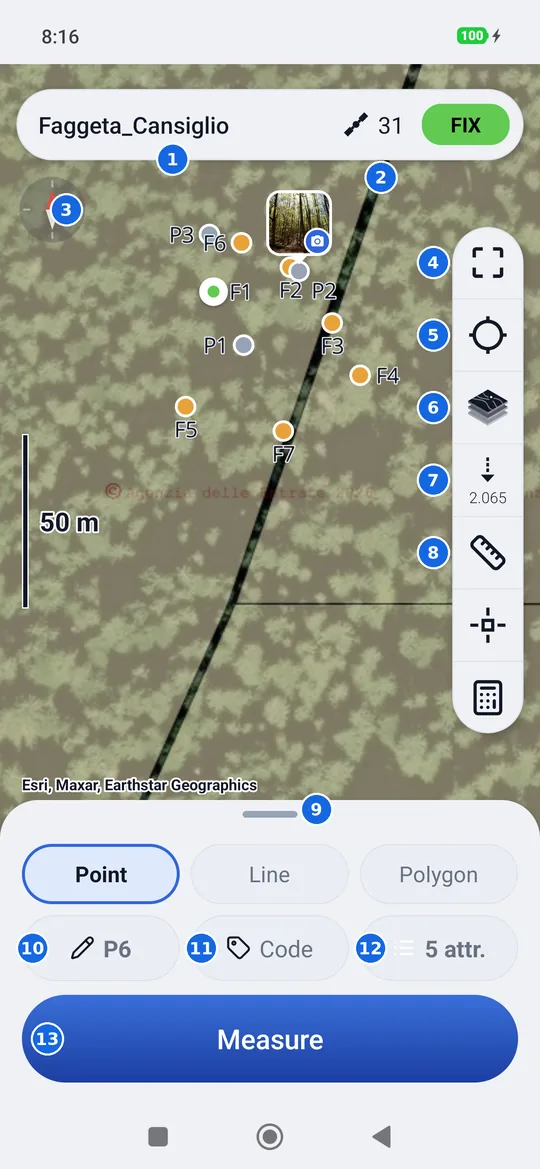
- The open project. Tapping it takes you to the list of projects.
- Satellites and solution: a tap opens the status panel.
- The compass: the red needle points north. A tap puts north back at the top (see Rotating the map).
- Zoom to fit all the points of the project.
- Your position: the map follows you, then turns with your heading (see Rotating the map). It is there only with the receiver connected.
- Change the map: opens Maps.
- Pole height: under the icon, in small type, the pole height you wrote (0.000 by default).
- Measure on the map a distance (ruler) or an area (pentagon): hold it down to switch between them.
- The handle of the sheet: tap or drag it to raise or lower it.
- The name of the next point.
- The code of the next point.
- The attributes of the project: how many there are; tapping opens them.
- Measure.
The points on the map
| Symbol | What it is |
|---|---|
| Dot with a white rim | Your position (the receiver's antenna), in the colour of the solution: green FIX, yellow FLOAT, light blue DGPS, red a single (uncorrected) position. With corrections (DGPS, FLOAT, FIX) the centre of the dot pulses; with a single position, which is not precise, a halo pulses around it |
| Arrow with a white rim | Your position while you walk: it points where you are going |
| Grey dot | A measured point |
| Orange dot | A point imported from a file: a point to stake out |
| Purple diamond | A point entered manually |
A tap on a point opens its card, with Edit, Stake out, Delete and Close.
Pinching your fingers together zooms out, spreading them zooms in; on the left the scale bar tells you how long that segment is on the ground. You can go down to the millimeter, as in a CAD: past the 20 cm of the bar the background disappears (beyond its own detail it would only be a blur) and points, lines and drawings keep growing, with the bar in millimeters. Two points a few millimeters apart are seen separately, and measurements and snapping stay exact. Zooming out, the background comes back by itself.
Rotating the map
The map is rotated with two fingers, turning them on the screen. The compass at the top left tells you where north is: one tap and the map goes back to north at the top.
The position button, in the column on the right, has three states: each tap moves to the next one.
| Icon | The map |
|---|---|
| Empty crosshair | It is free: it moves only with your finger |
| Crosshair with a dot, blue | It follows you: your position stays in the center |
| Blue arrow | It follows you and turns with your heading: what is in front of you is at the top |
The map turns with the direction of travel given by the receiver, not with the phone's compass: when you stand still it stays turned the way your last step left it. Moving the map with your finger makes it free again; in the stakeout the button only alternates between “follows you” and “turns with your heading”.
The sheet at the bottom
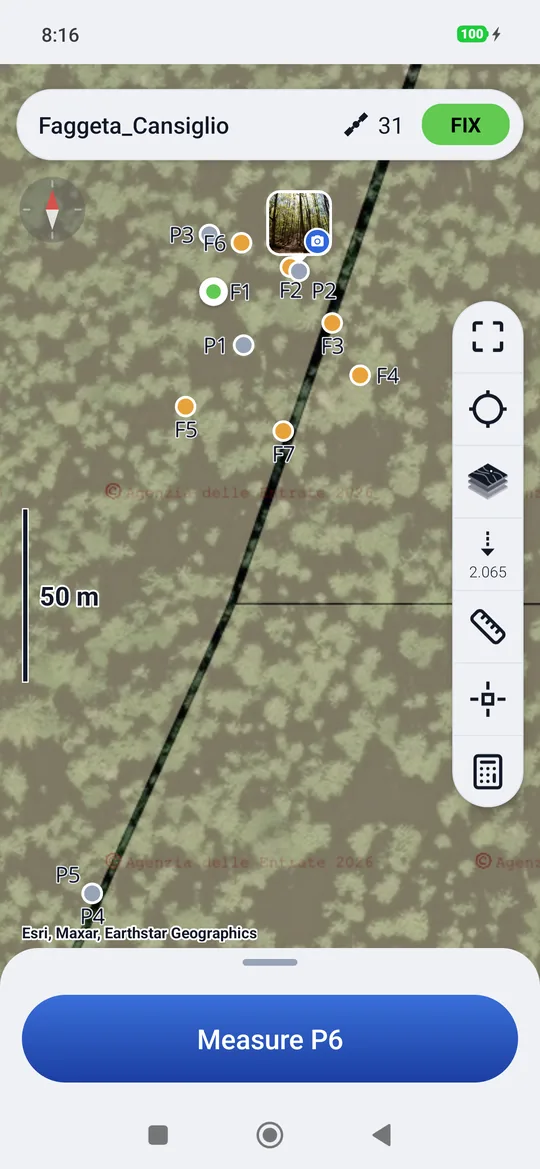
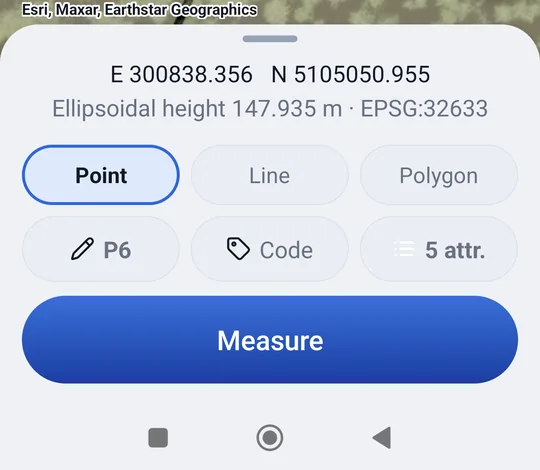
The sheet has three heights. You change it with a tap on the handle (it goes up, then down) or by dragging it up or down, also from the top part of the sheet (the time, the coordinates); a tap on the map lowers the raised sheet again.
| Height | What it shows |
|---|---|
| Lowered (on opening) | Only the button, which also carries the name: Measure P6. The whole map is visible. |
| Normal | The three chips (name, code, attributes) and Measure. |
| Raised | In addition, the grid coordinates of the point where you are (E and N in the project's reference system) and the ground elevation, ellipsoidal or a.s.l. depending on the project, with the EPSG code of the system. |
Measuring a point
- Stand with the pole on the point and hold it still and level.
- Check that the solution is FIX.
- Press Measure.
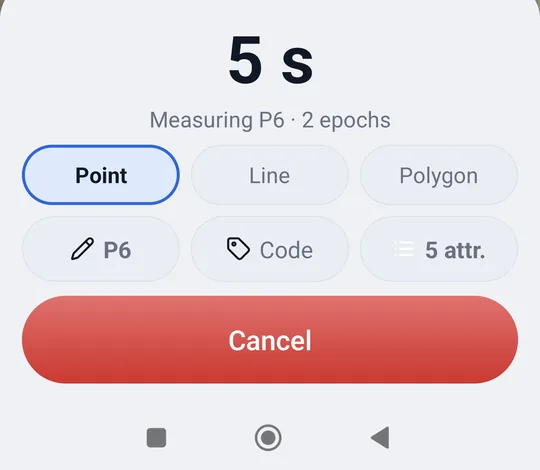
geosit collects the positions for the measurement duration (5 seconds by default, you change it in the Settings) and averages them. During the measurement the sheet shows the countdown and how many positions (epochs) it has collected, and the button turns red: Cancel.
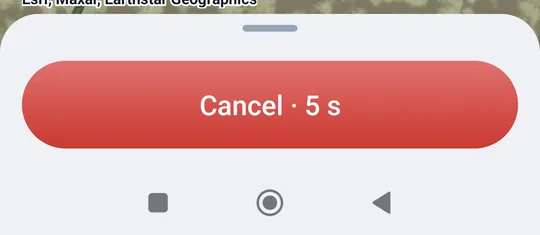
When the measurement is over the phone vibrates, plays two high notes and for a few seconds the button turns green and says Saved P8 · FIX: name and solution. Above it, with the sheet not lowered, there is the estimated accuracy (H 0.009 m · V 0.014 m). The name advances by itself to the next point (P8 → P9); while the button is green it is only a notice and does not respond to taps.
If the project has attributes and the GIS package is there, the point card to fill in opens right after.
How the point is computed
If among the collected positions there is at least one FIX, only the FIX ones count: a FLOAT in the middle would spoil the centimeter. The saved elevation is that of the ground: geosit subtracts the pole height, plus the 65 mm of the MS2, from that of the antenna.
The questions before the measurement
| Dialog | When | What to do |
|---|---|---|
| The solution is FLOAT (or DGPS, Single…) | The solution is not FIX | Measure to save a non-centimetric point anyway, or cancel and wait for the FIX. |
| The name P8 already exists | The project already has a point with that name | Save to keep both with the same name, Rename to use the first free name (P9…), or Cancel. |
| Close to P5 | When the measurement ends, the point is closer to P5 than the duplicate distance | Save to keep it anyway, Cancel to discard it. It also applies to a point entered by hand; not in stakeout, nor in automatic mode. |
| Measuring | You leave the survey during a measurement | Leave loses the measurement. |
If you leave the screen during the measurement
If during the measurement you switch to another app or a phone call comes in, the measurement is cancelled and when you come back geosit says so (Measurement cancelled): the point has not been saved, it must be measured again.
Name, code and attributes
The three chips of the sheet tell you what the next point will be called.
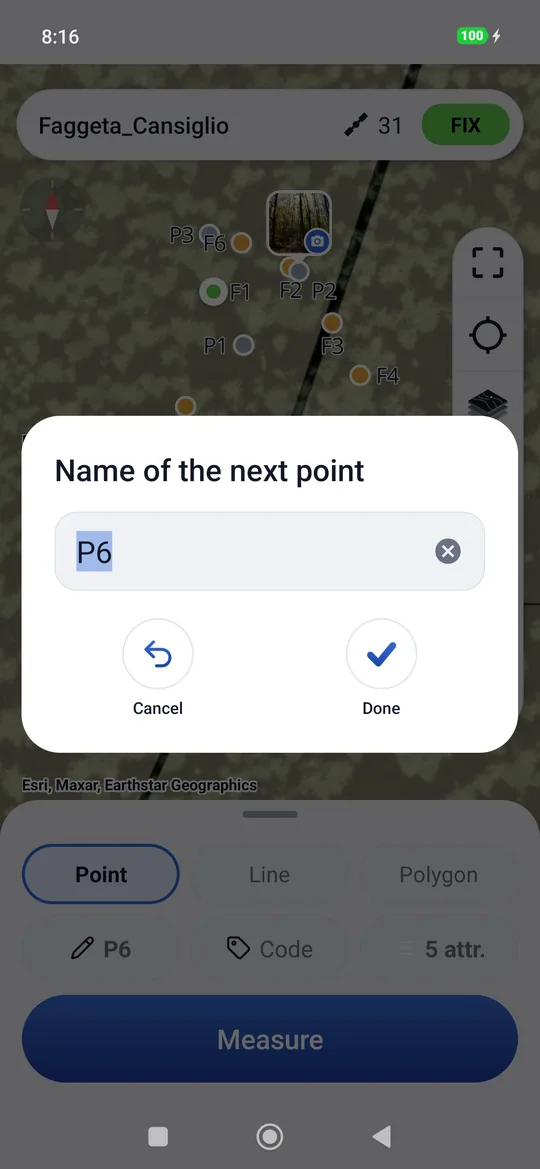
- Name: tap it to write a different name (Name of the next point). From then on the
name advances from that one:
P9→P10,102→103,PALO→PALO1. The step (of 1, 2, 10…) and the first name of new projects are chosen in Settings → Point numbering. - Code: a word that describes the point (
Beech,Boundary,Stake…). It stays the same for the following points until you change it; when empty, the chip says Code in grey. - Attributes: how many attributes the project has. Tapping it opens the list of attributes, to add one even in the field. It is there only with the GIS package.
Lines
With the Pro package, above the chips there is the Point · Line · Polygon row. On Line each measurement adds a vertex to a line: a boundary, a fence, the edge of a road. The vertices are points like any other, with name, code and attributes.
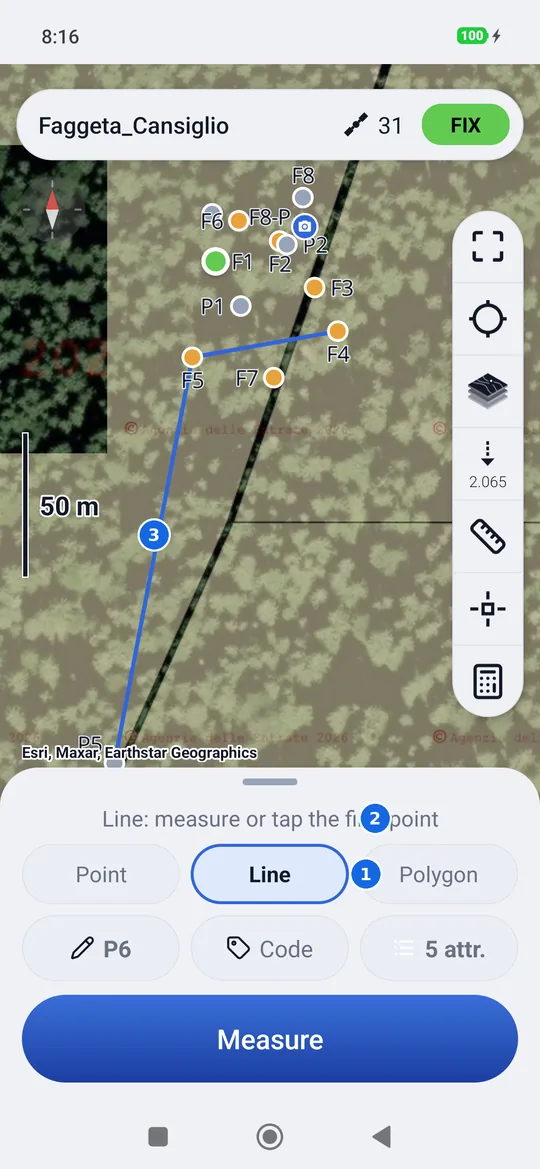
- Point or Line: what the next measurement becomes.
- How far the line has got, for example Line · 3 points · tap «Line» again for a new one.
- The line on the map, from the first vertex to the last.
- Tapping Line again starts a new line; Point ends it and measurements go back to being loose points.
- Deleting a vertex removes it from the line, which joins the remaining vertices.
- In the export lines go into the DXF as 3D polylines on the
LINEElayer and into the KML as lines (Linea 1, Linea 2…). Shapefile and GeoPackage have them in thelineeandpoligonilayers, in 3D. The CSV only has the points. - Polygon works like Line, but the outline closes by itself: on the map the last vertex
goes back to the first. In the DXF it is a closed polyline in the
POLIGONIlayer, in the KML a polygon (Poligono 1…); in the Pregeo booklet the first vertex is repeated at the end. - Points created by hand while Line or Polygon is chosen (with the snap's Create, or typing the coordinates) also become vertices of the current line: so a line can be drawn by snapping to the drawings too, without measuring.
- With Line or Polygon chosen, tapping a point already surveyed on the map makes it the next vertex (if it was in another line, it leaves it): so a line can be made on points already measured too. The same with the snap's Create on a point of the job, with no duplicates. A point that is already in the line opens its card instead.
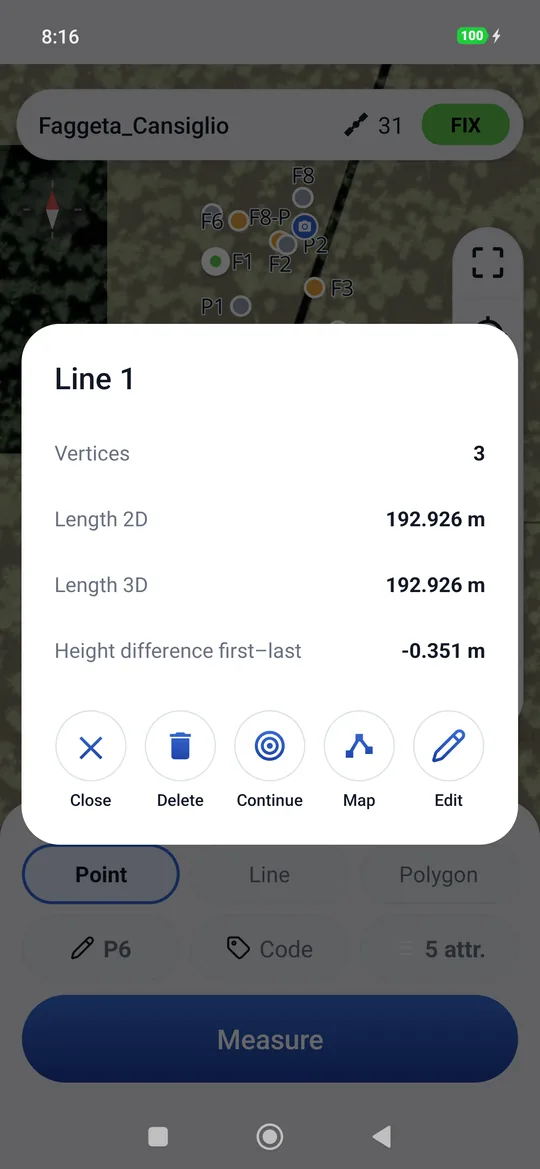
- Tapping a line or a polygon on the map opens its data: vertices, 2D and 3D length and the height difference between first and last; for the polygon area and perimeter in 2D and 3D. The polygon has a lightly shaded inside: just tap inside it, no need to hit the edge.
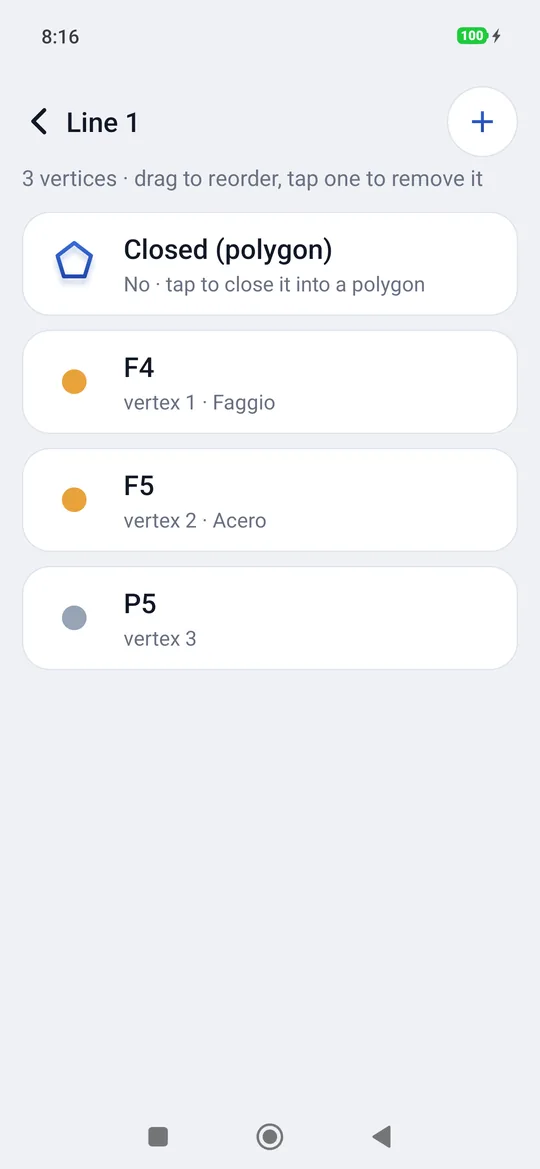
- In its card Map corrects the line on the map by dragging the vertices, Edit opens the vertices in order: press and hold a vertex and drag it to change its place; tapping one moves it up or down or removes it from the line, the + at the top right adds a point at the end, the Closed (polygon) row closes it or reopens it. Delete asks whether to keep the points, on their own, or delete them with the line. All step by step in Lines and polygons by hand.
- Continue, in the same card, resumes the line: the next measurements and the points tapped go at the end.
- In scenes the lines are skid marks, edges and stripes: see Scenes.
Automatic point
With Automatic point on in the Settings (every so many seconds or metres) the big button becomes Start automatic, and above it always says Automatic · a point every 5 m: before starting you know which points you will take.
- Tap Start automatic: the first point is taken right away, where you are.
- Walk: every time the chosen seconds or metres go by, geosit saves a point with the position of that moment and the next name. The button is red, Stop automatic, and above it counts the points.
- Tap Stop automatic: 12 automatic points saved.
With Line or Polygon chosen, the automatic points are the vertices of the line. During the automatic mode the attribute card does not open: the values are written later from the points list.
The pole height
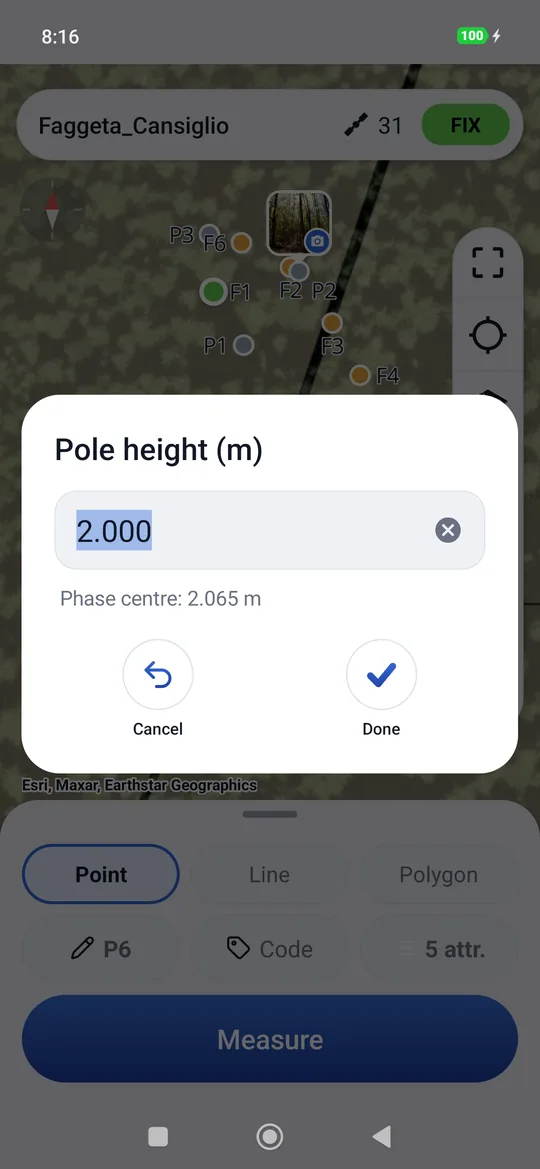
The command with the dashed arrow, in the column on the right, opens Pole height (m): the height of the antenna above the tip of the pole, from 0 to 10 meters (0 by default: set it). You can write it with a point or a comma. It applies to all the following points and stays saved in the point (Palina column in the export). If it is still 0, at the first measurement geosit reminds you once: Measure goes on, Set opens the height.
geosit adds by itself the fixed 65 mm of the MS2, from the mount on the pole to the antenna phase center: with 2 m written, the ground elevation is that of the antenna minus 2.065 m. Under the icon in the column you read the height at the phase centre, 2.065, and in the window, under the field, «Phase centre: 2.065 m» as you type; in the export (Palina column) you keep the height you wrote, 2.000.
Wrong pole = wrong elevation
When you lengthen or shorten the pole, you must change it here too: the ground elevation is that of the antenna minus the pole (and the 65 mm of the MS2).
Entering a point manually
You can place a point without measuring it, for example a vertex taken from a map. Touch and hold on the map in a place without points: geosit places a temporary mark and opens New point.
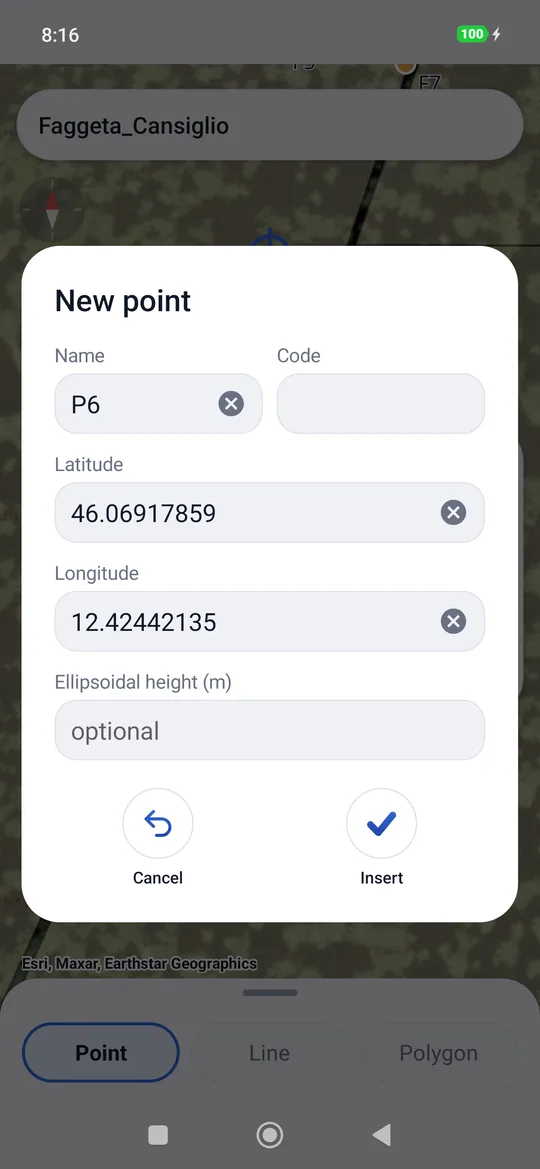
The fields are already filled in: the next Name, the Code from the chip, Latitude and Longitude of the pressed place (in decimal degrees, with a point). The Elevation is optional. They can be corrected: the mark on the map follows the coordinates, a wrong field turns red and Insert stays off until it is right.
The point enters the project as entered manually (purple diamond), without accuracy or pole. If the name already exists, geosit saves it with the first free name and says so.
Measuring distances and areas
The ruler command measures on the map, without saving anything. There is only one for the distance (ruler) and the area (pentagon): holding it down switches between them, even once the measurement has started, and the vertices already tapped stay.
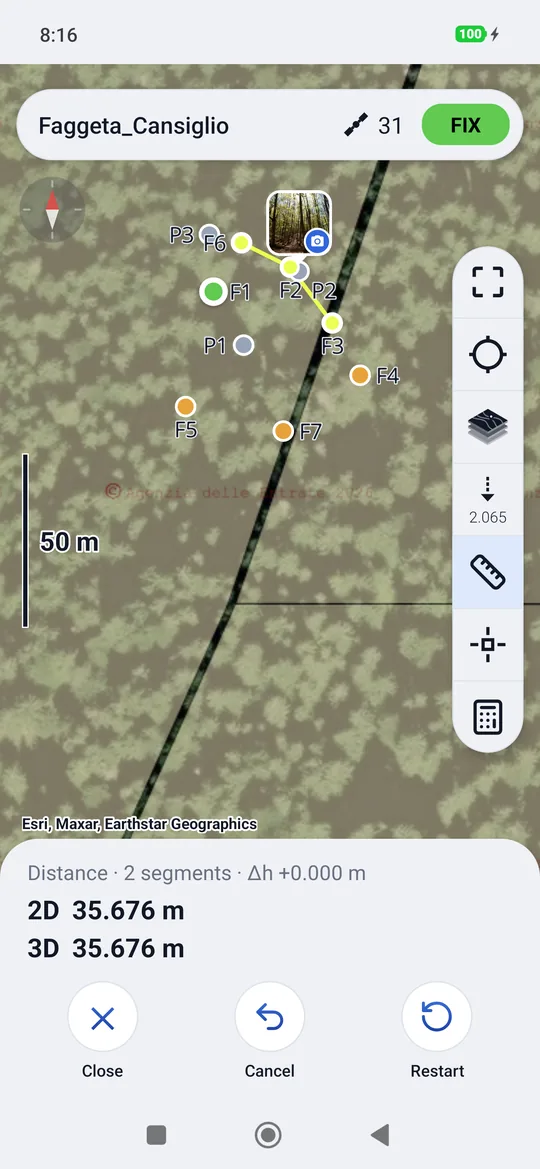
- Tap the ruler (distance) or the pentagon (area): the box lights up and the sheet becomes the tool bar.
- Tap the points on the map, one after the other. Tapping near a point of the project snaps to it and takes its elevation. With a DXF drawing in the project (Pro) it also snaps to its notable points, vertices, midpoints, centers and intersections (the same ones turned on in snapping), with the drawing's elevation if it has one. Elsewhere you place a free vertex, without elevation.
- Read the results in the bar.
With the snap (Pro): with the ruler or the pentagon in hand, also tap the snap in the column: both stay on. The crosshair with the drawings' magnet appears in the middle; a tap on a point or on a snappable mark places the vertex right there. For a vertex anywhere else, move the map until the crosshair snaps and tap Add in the bar. Tapping the snap again goes back to tapping the points.
Drawing a line without measuring (Pro): the snap bar also has Point · Line · Polygon. With Line or Polygon each Create adds a vertex to the current line: so a line is drawn on the map, snapping to the drawings and to the job's points, even without a receiver. The snap is always there, even in a job without drawings. How to draw and correct: Lines and polygons by hand.
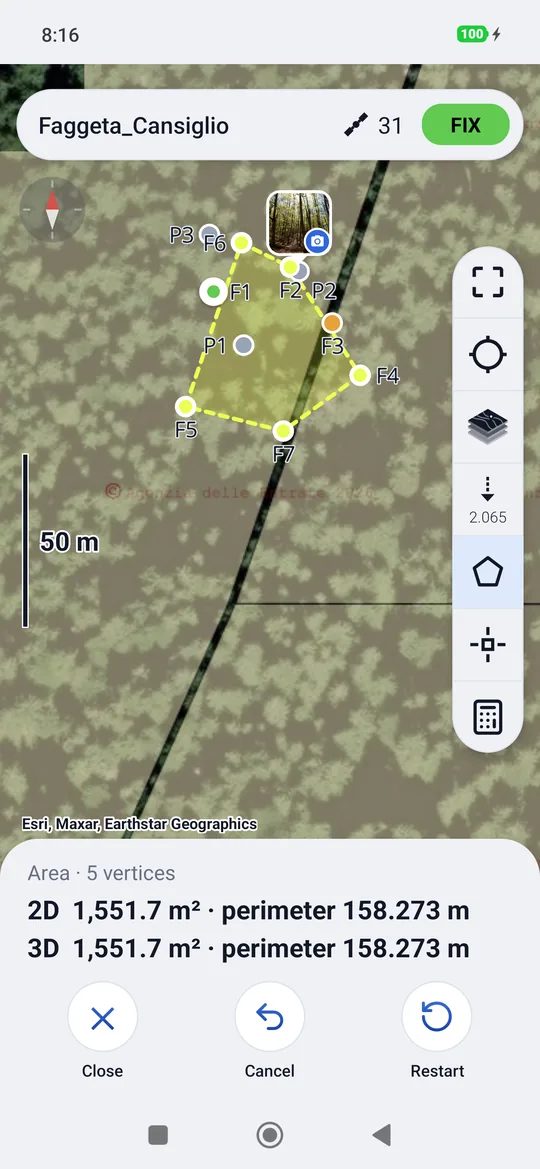
| Tool | What it tells you |
|---|---|
| Distance | How many segments, the height difference Δh between the first and the last point, the 2D length (in plan) and the 3D length (on the ground). |
| Area | How many vertices, the surface and the perimeter in 2D and 3D. Above 10,000 m² the surface is in hectares. If the polygon crosses itself, geosit warns that the area is not reliable. |
The 3D is computed only if all the vertices have an elevation; otherwise geosit writes how many vertices do not have one. Cancel removes the last vertex, Restart removes them all, Close (or the back button, or the icon again) leaves the tool.
Without a receiver
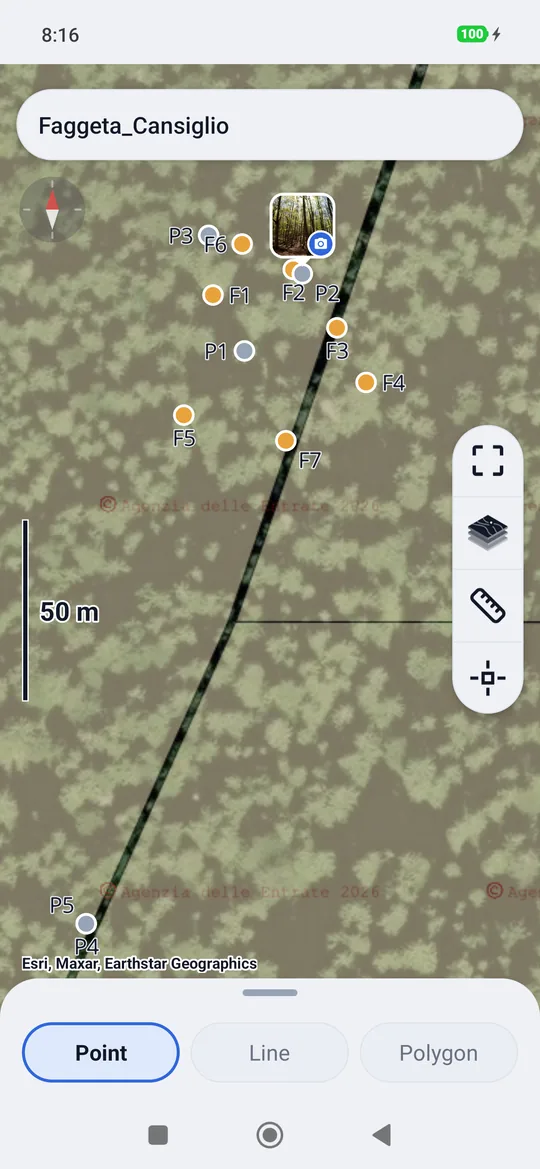
Without a connected receiver the survey shows only the map with the points: no sheet, no Measure, no pole. You can still look at the points, open their card, enter points manually and measure distances and areas. With the Pro package the Point · Line · Polygon choice stays at the bottom: with Line or Polygon the points entered by hand (press and hold on the map) become the vertices of the line, even without snap.
Static, kinematic and Stop & Go
The survey can also record the receiver's raw data file, for post-processing in the office: in static, in kinematic or in Stop & Go. It has its own page, Static, kinematic and Stop & Go.